Work Wharton Research Data Services
14 finance teaching tools, built with the people teaching
Yield curves, options pricing, topic modeling and sentiment analysis, turned into things a student can actually poke at.
- Client
- Wharton Research Data Services
- Role
- Developer
- Period
- 2019 to 2023
- Focus
- Development, Data Visualization, Education
- 14+ new classroom tools released
- 3 charting libraries in play
- Direct built with classroom specialists
I collaborated with classroom specialists to develop and release over 14 new teaching tools on the WRDS platform.
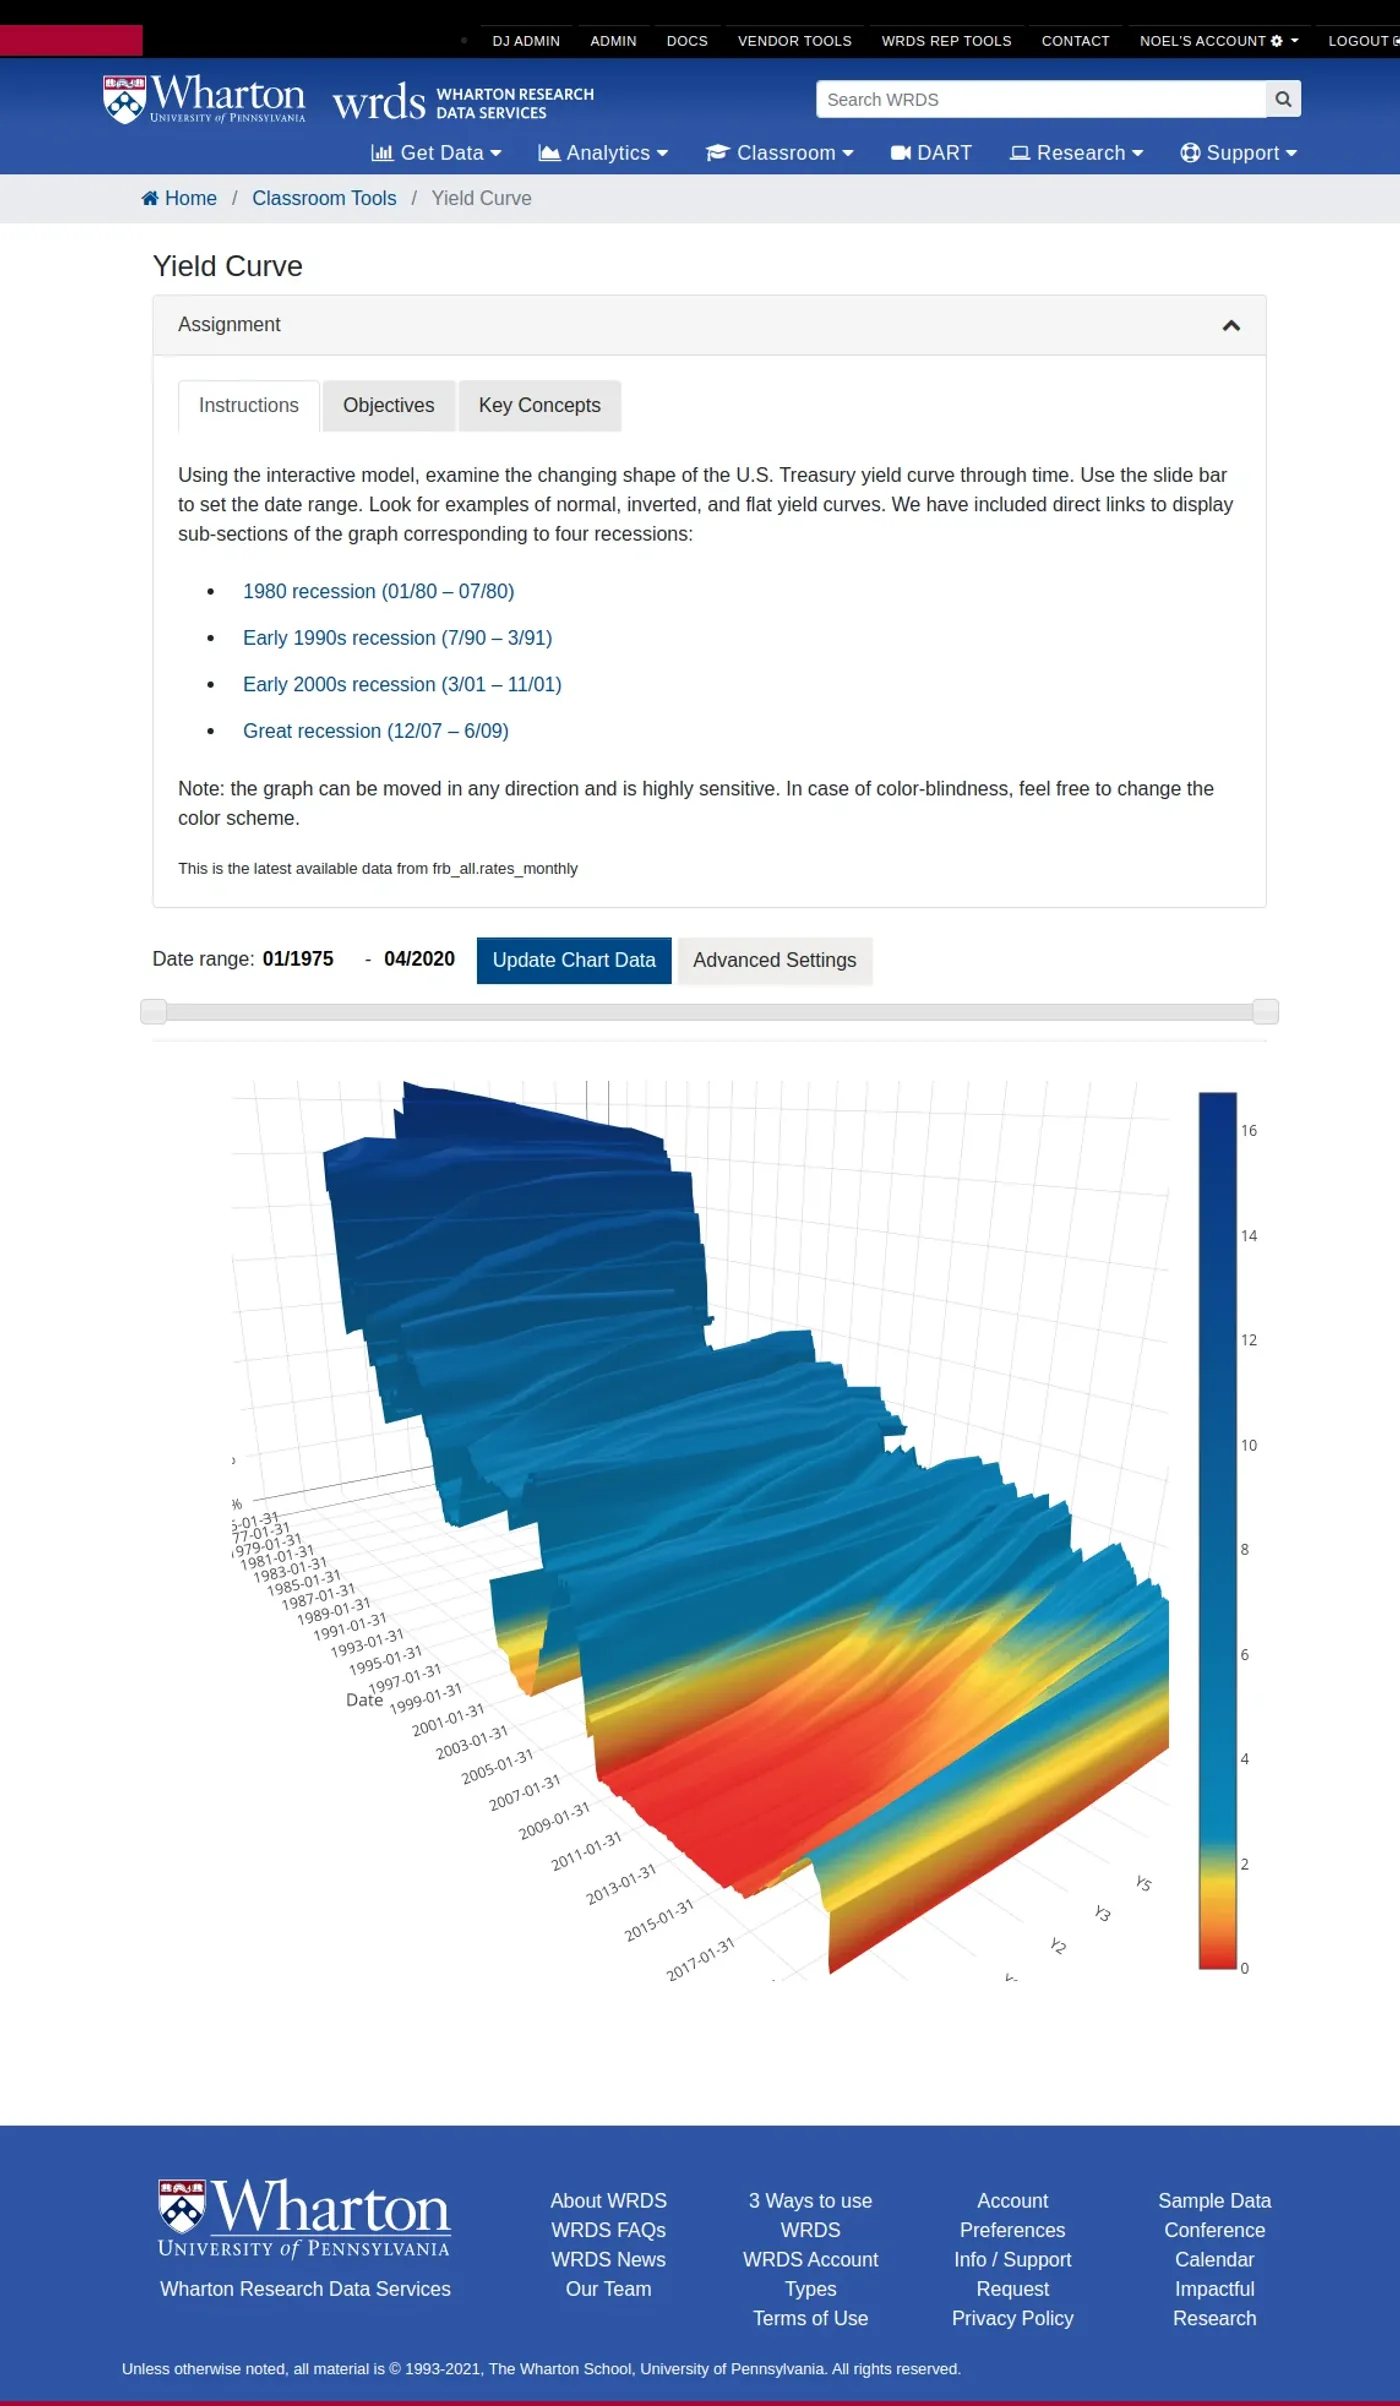
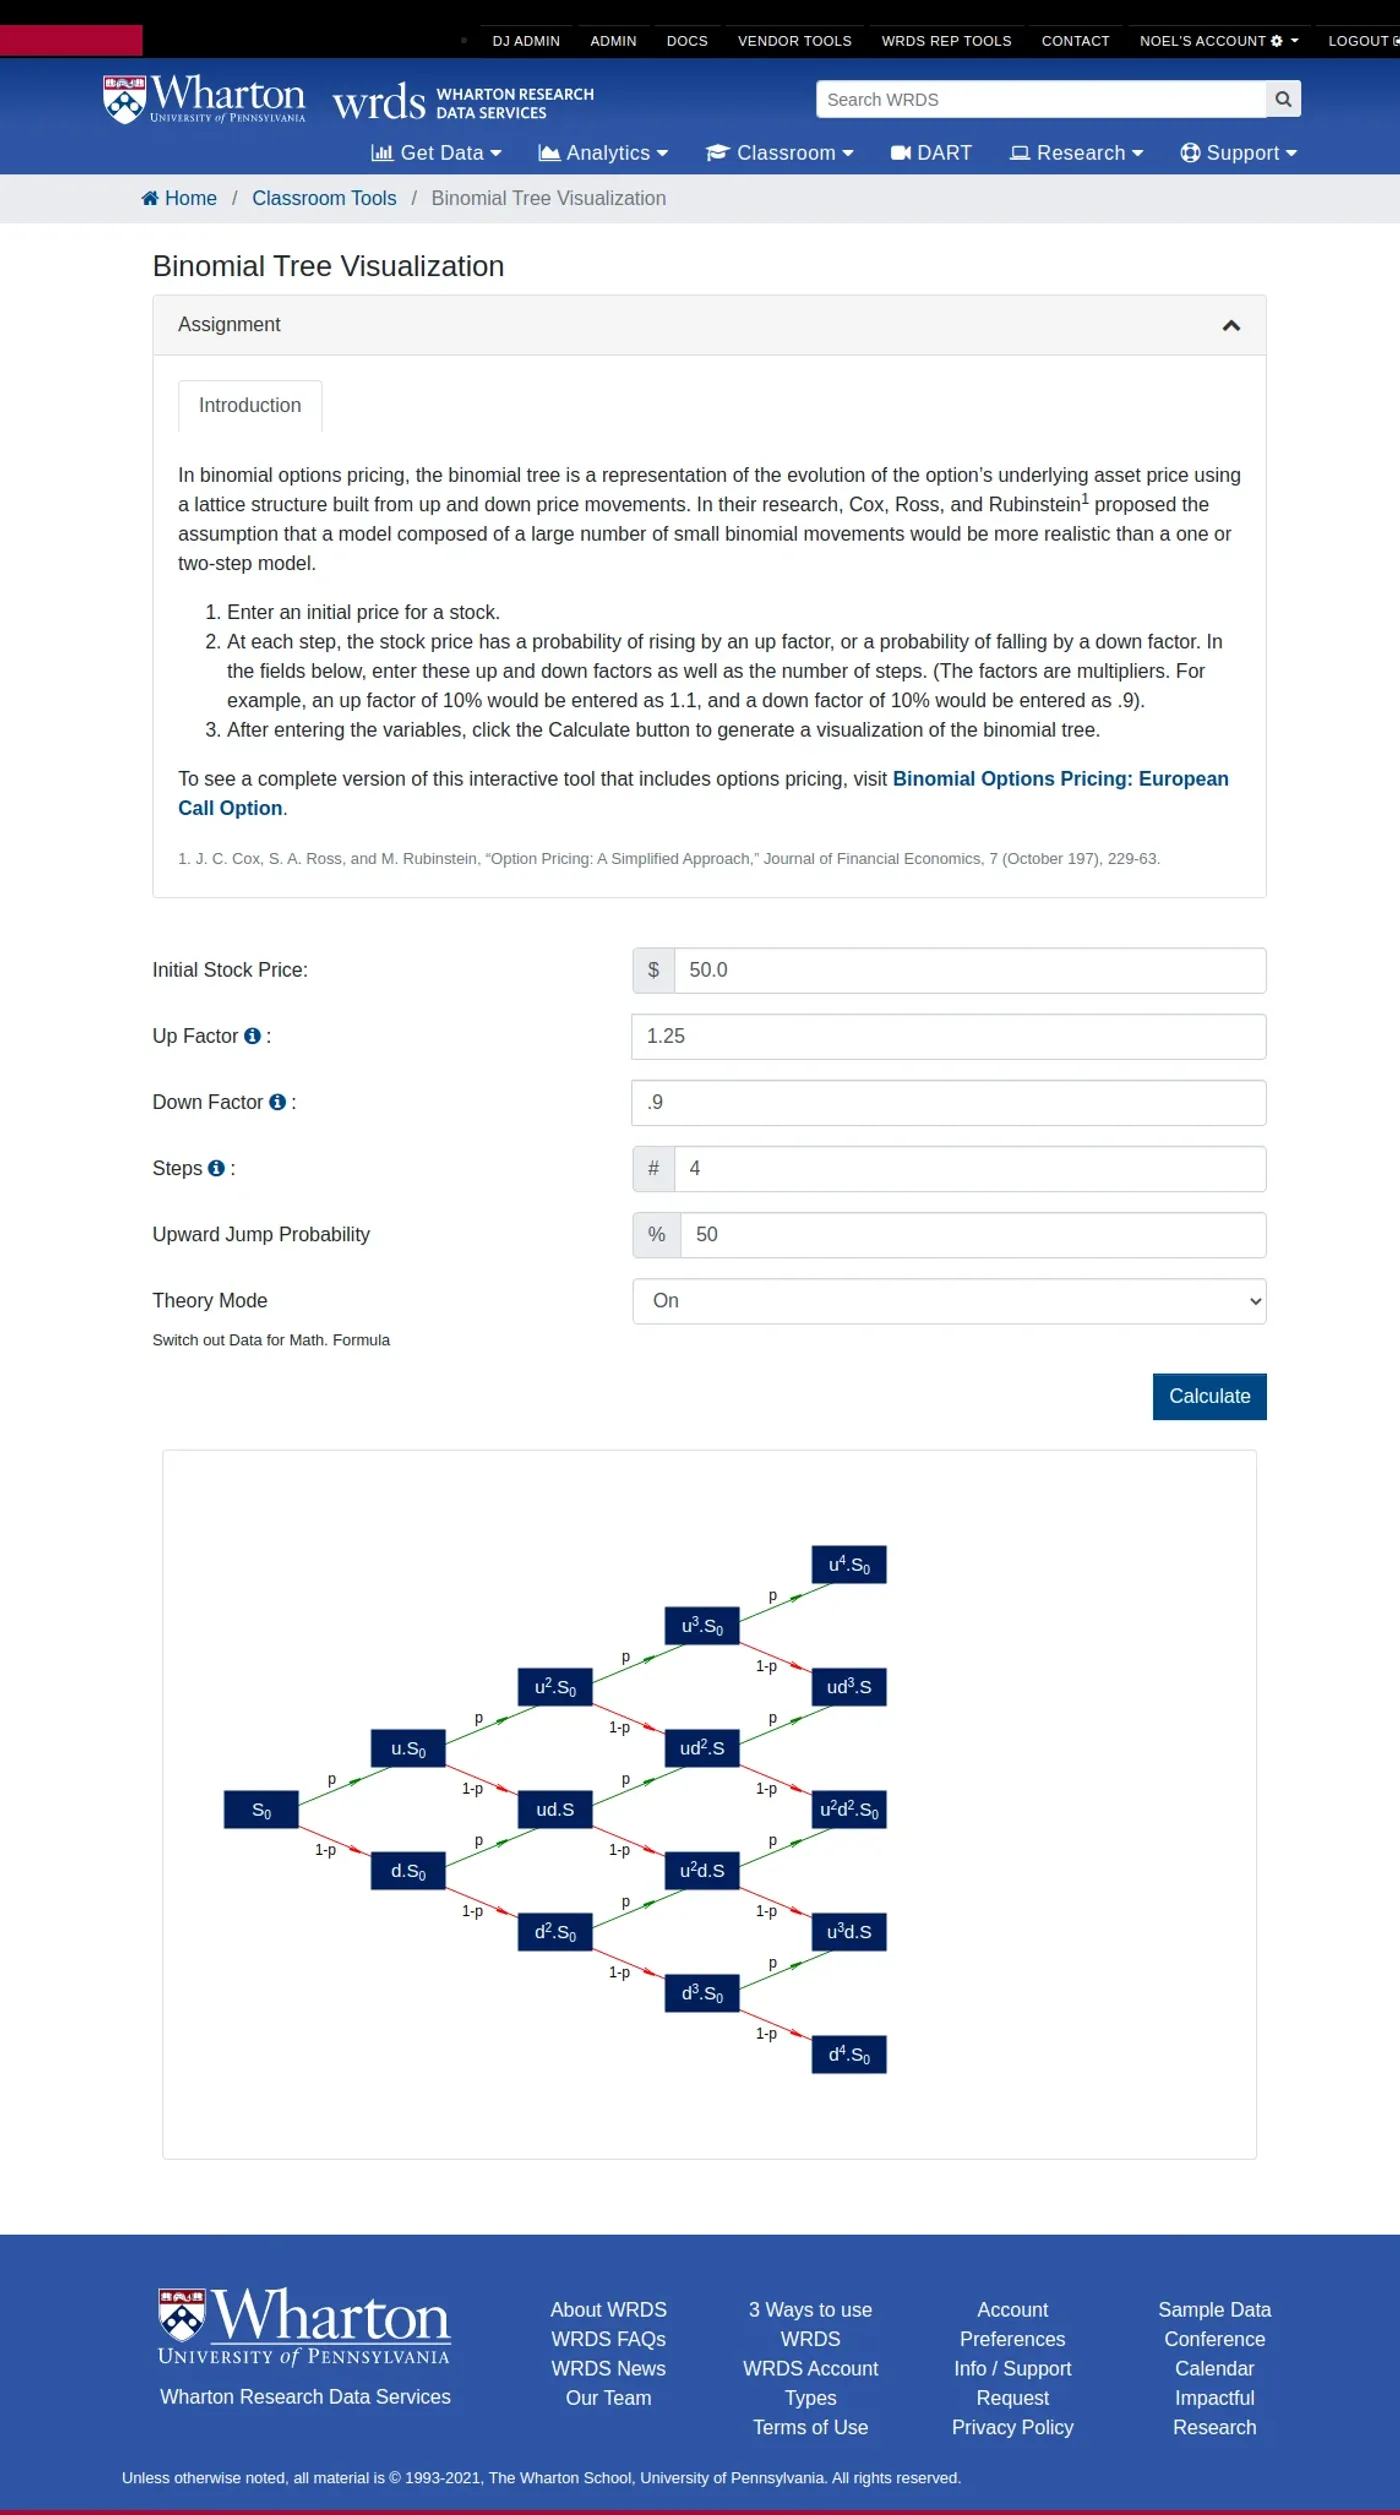
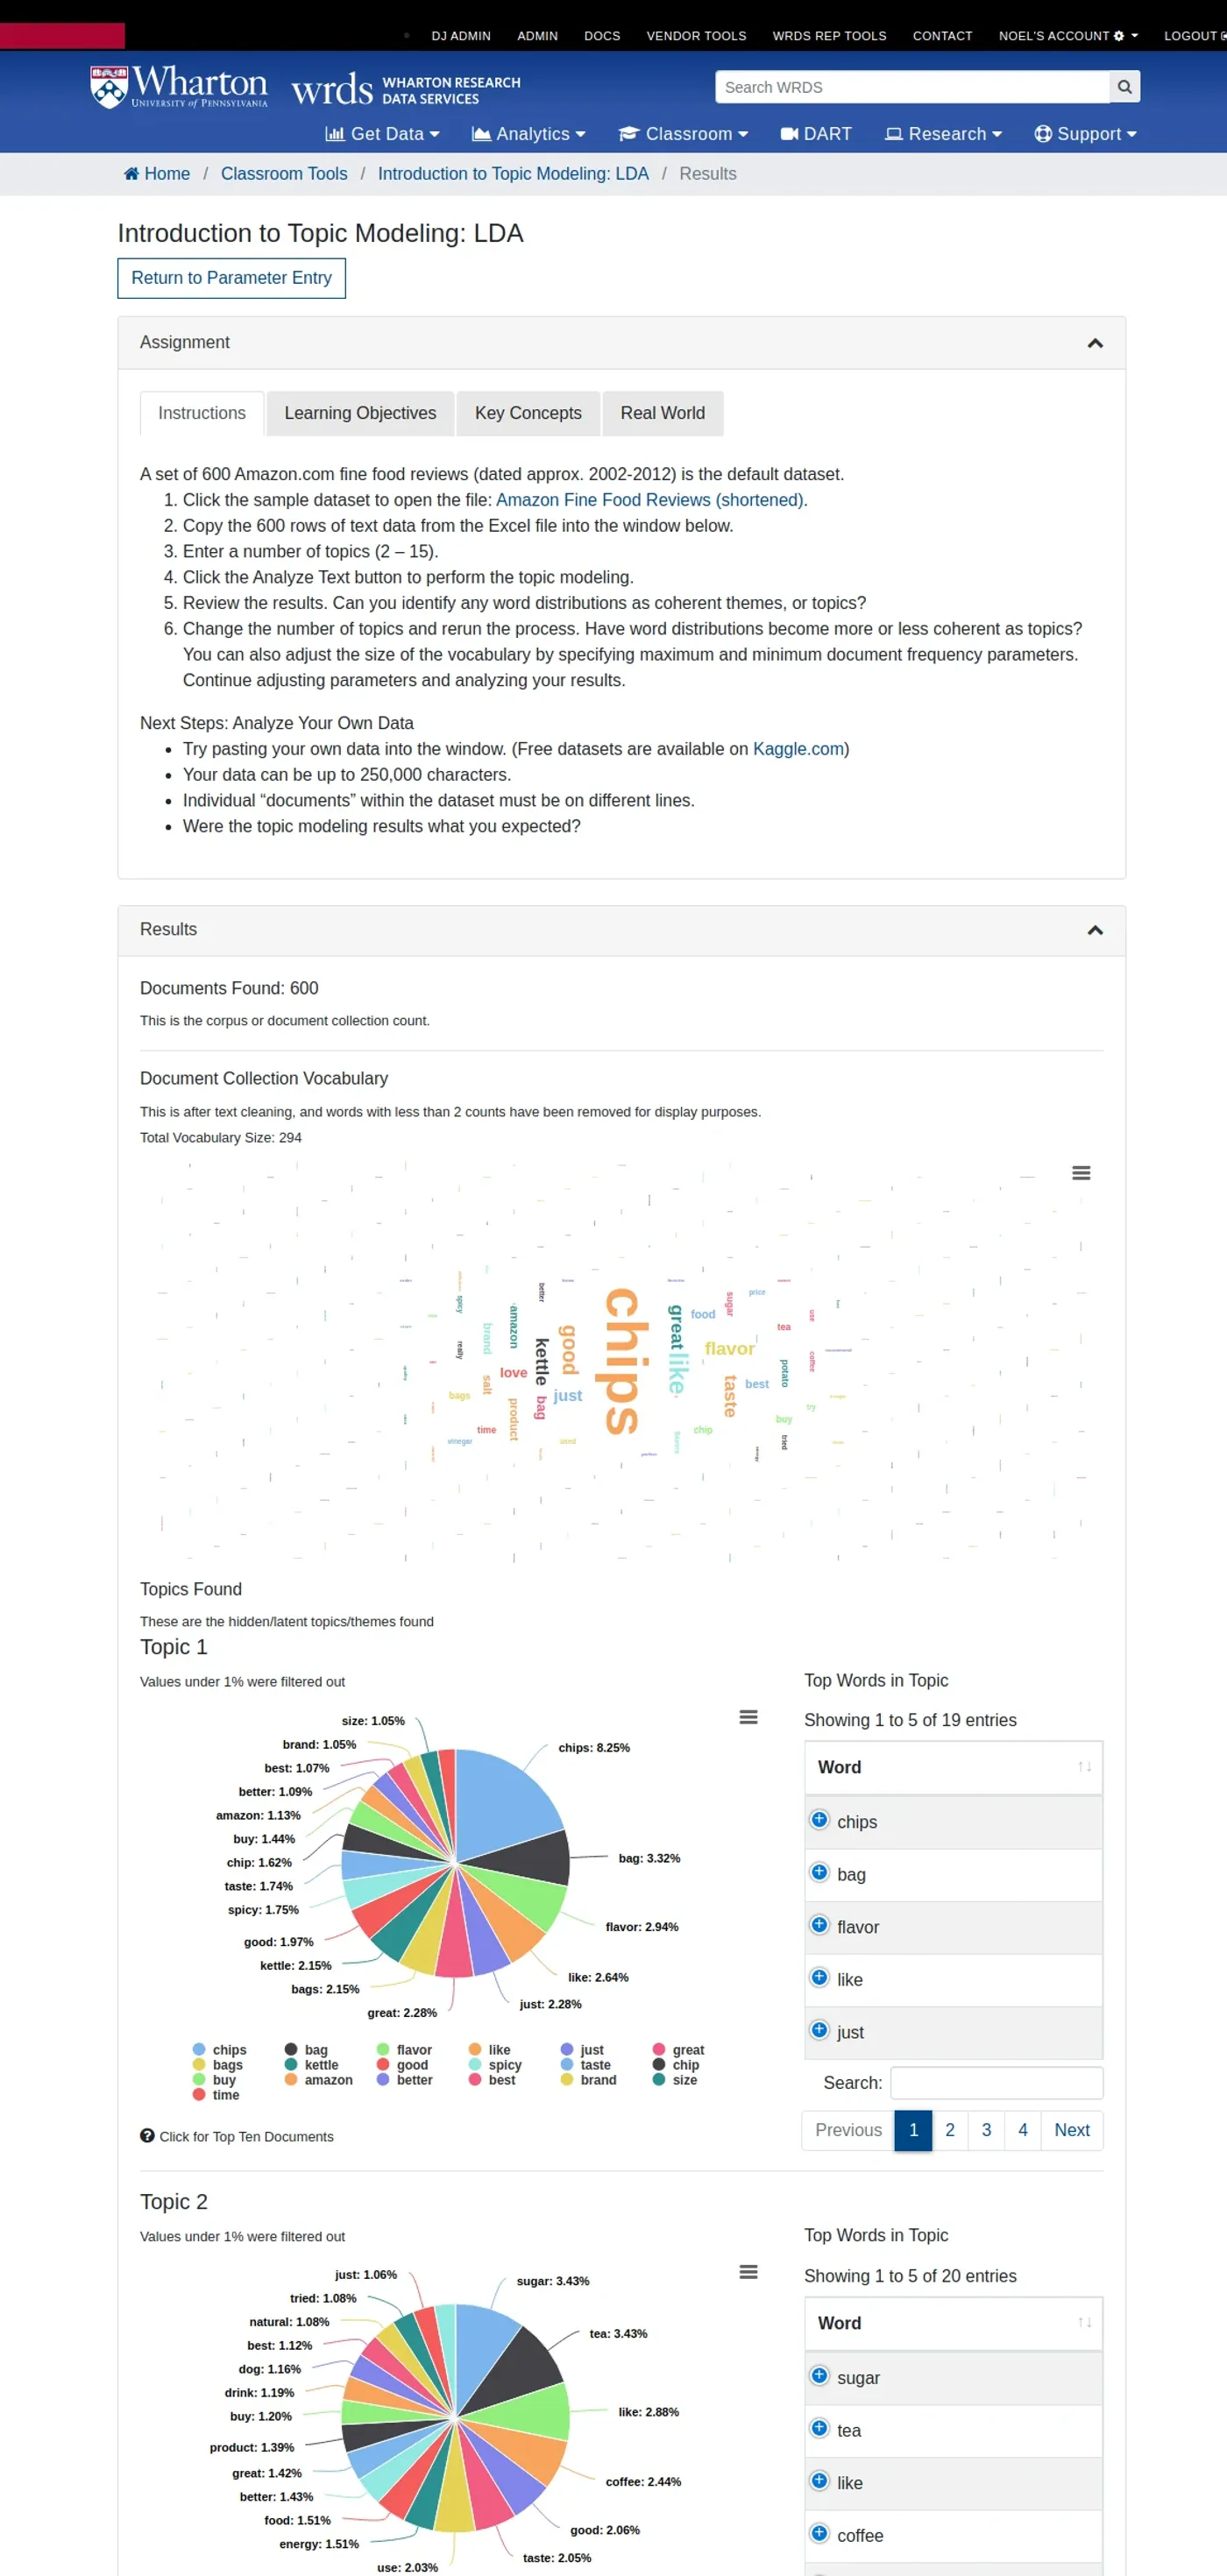
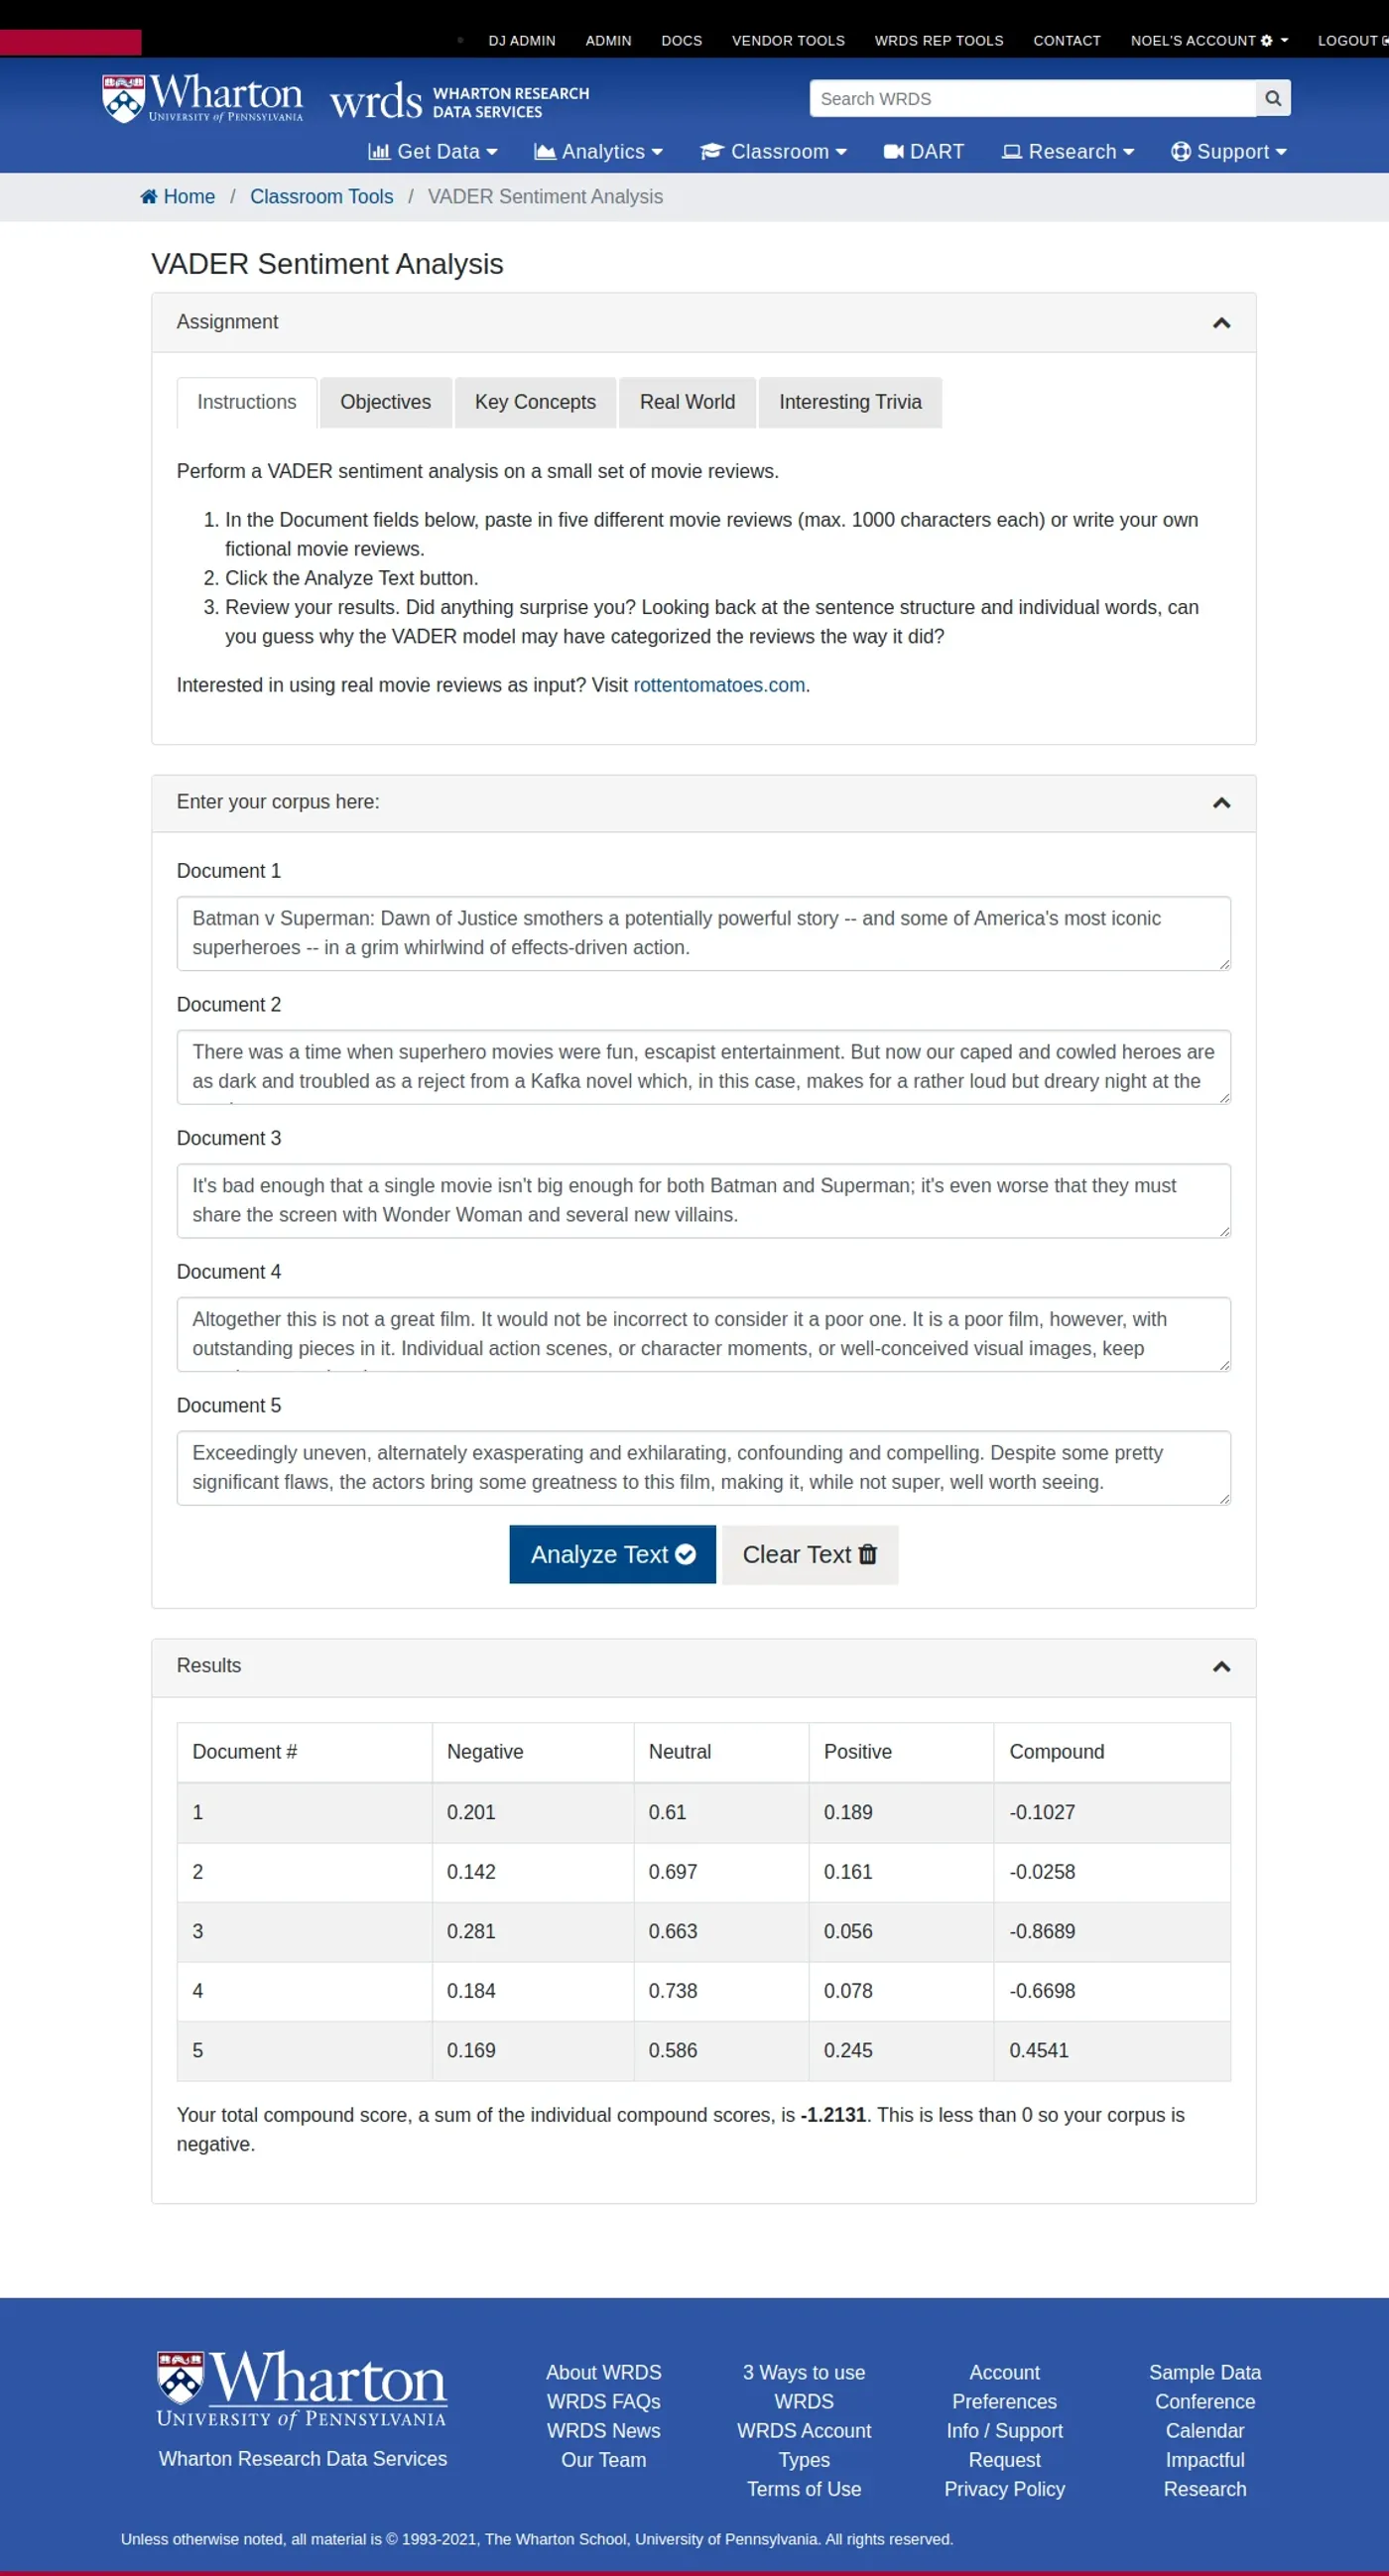
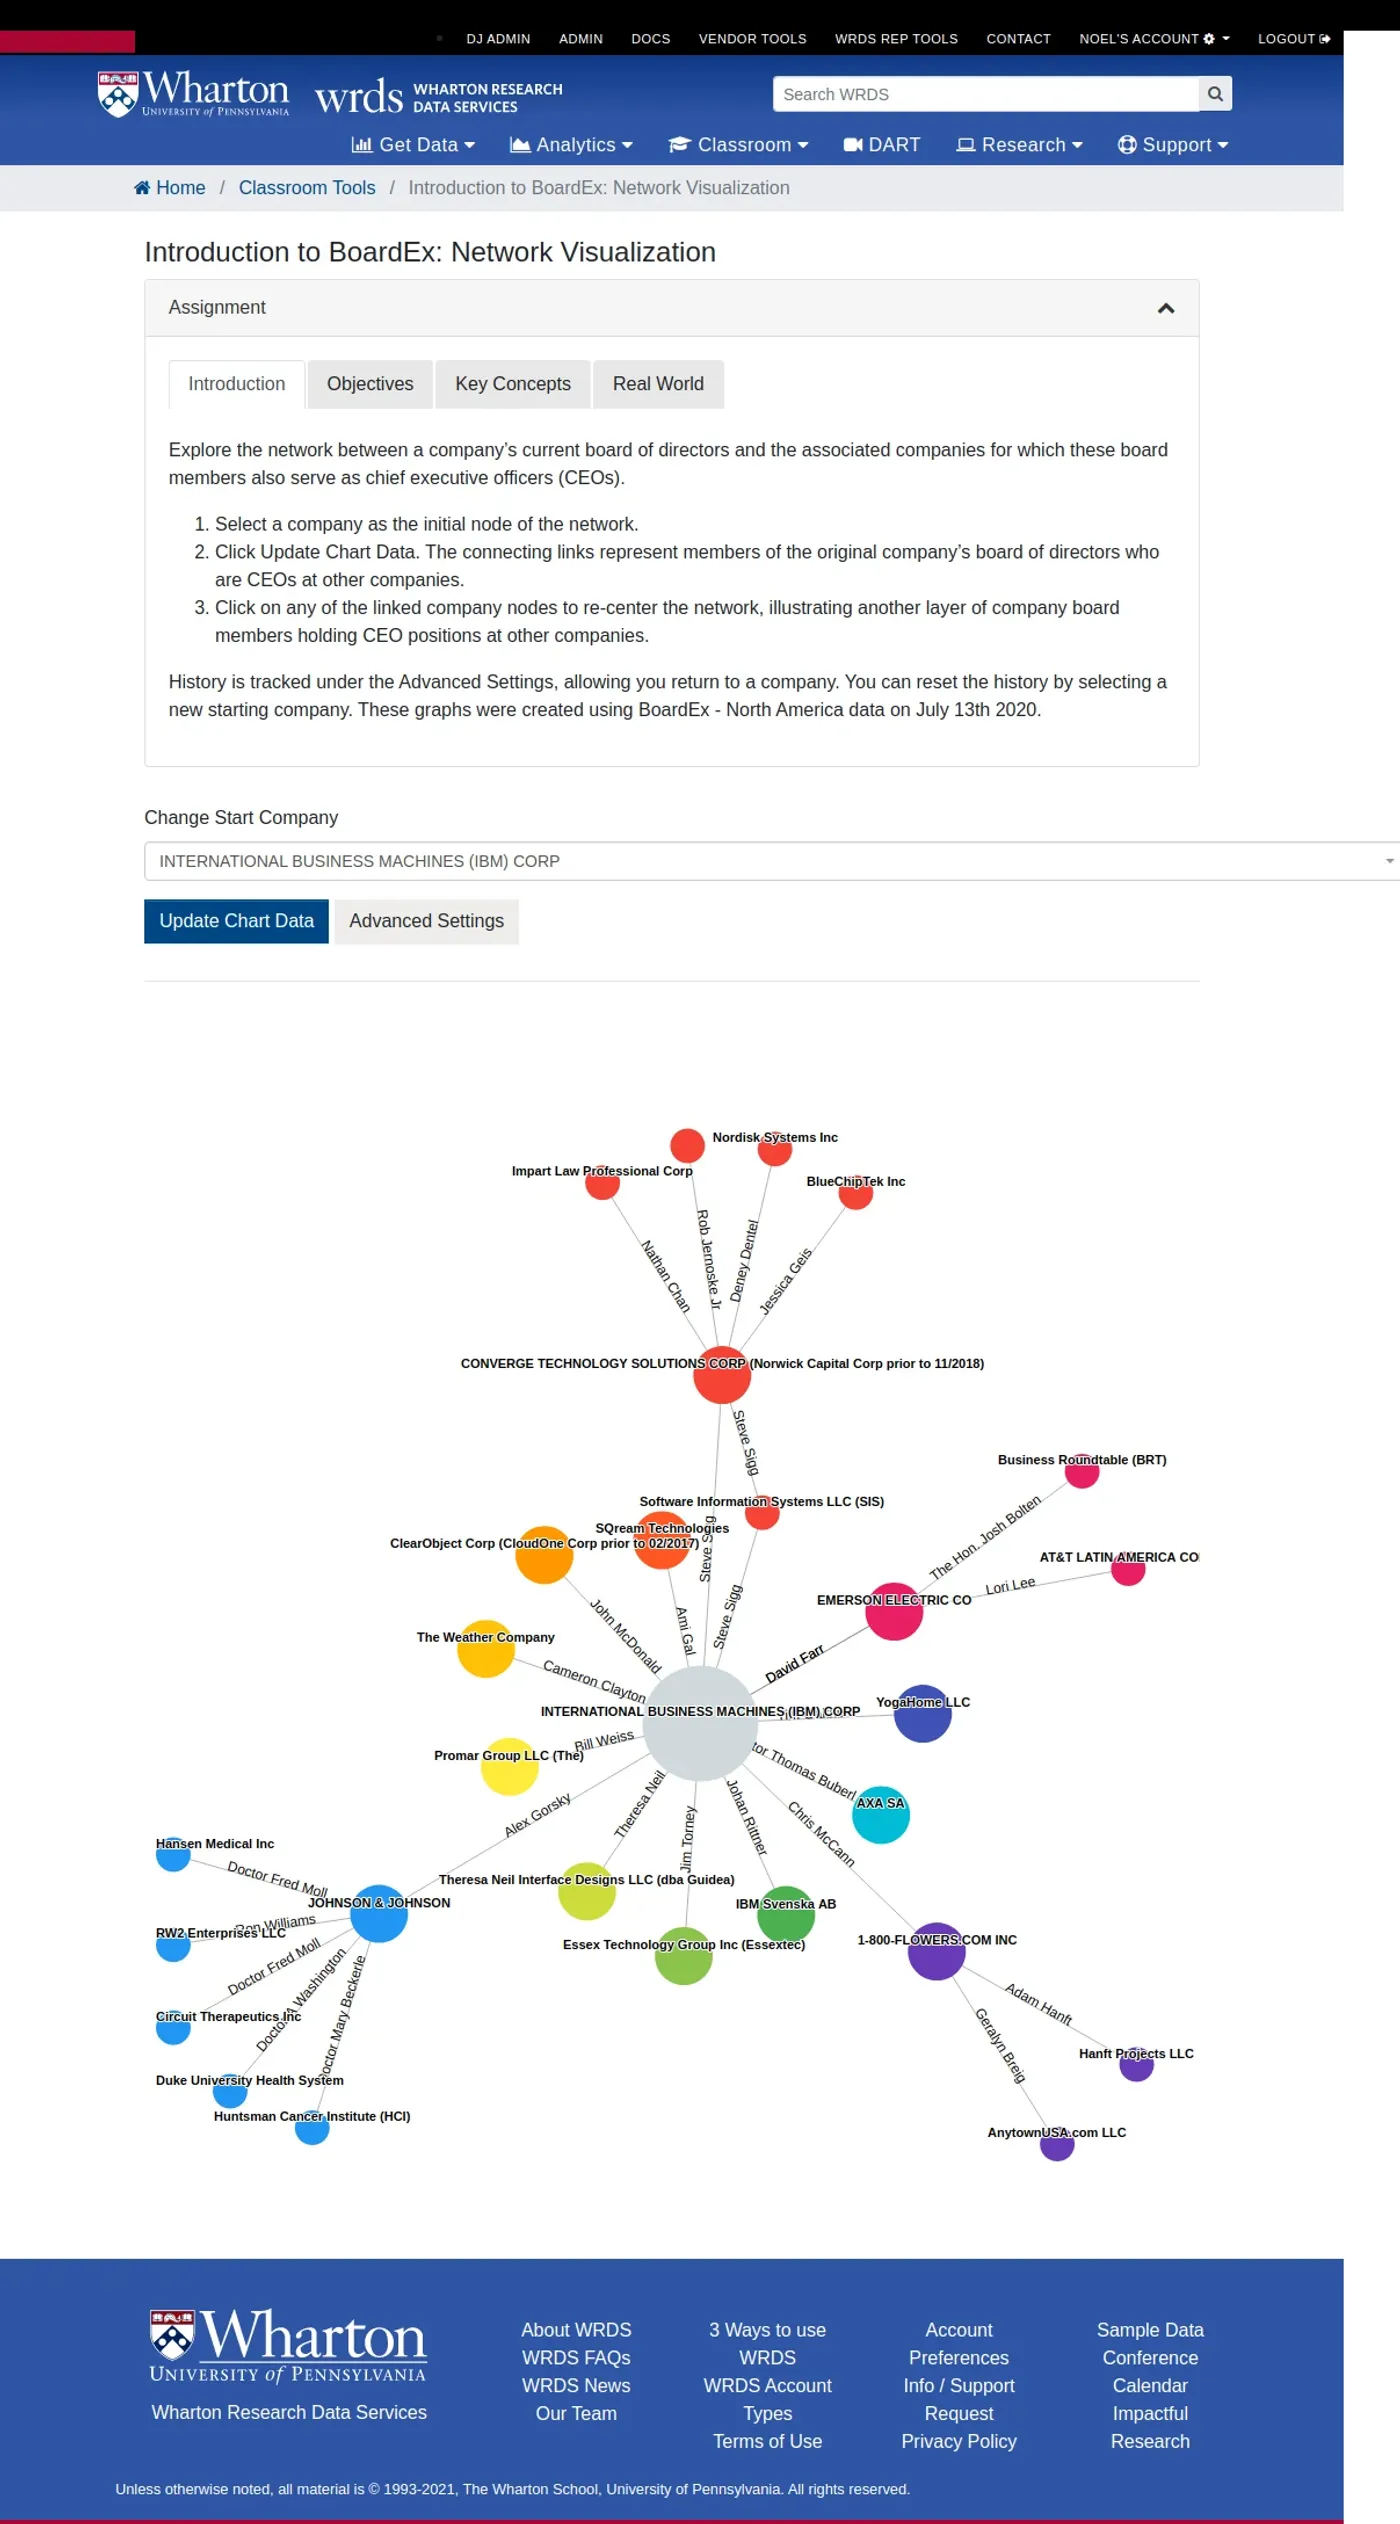
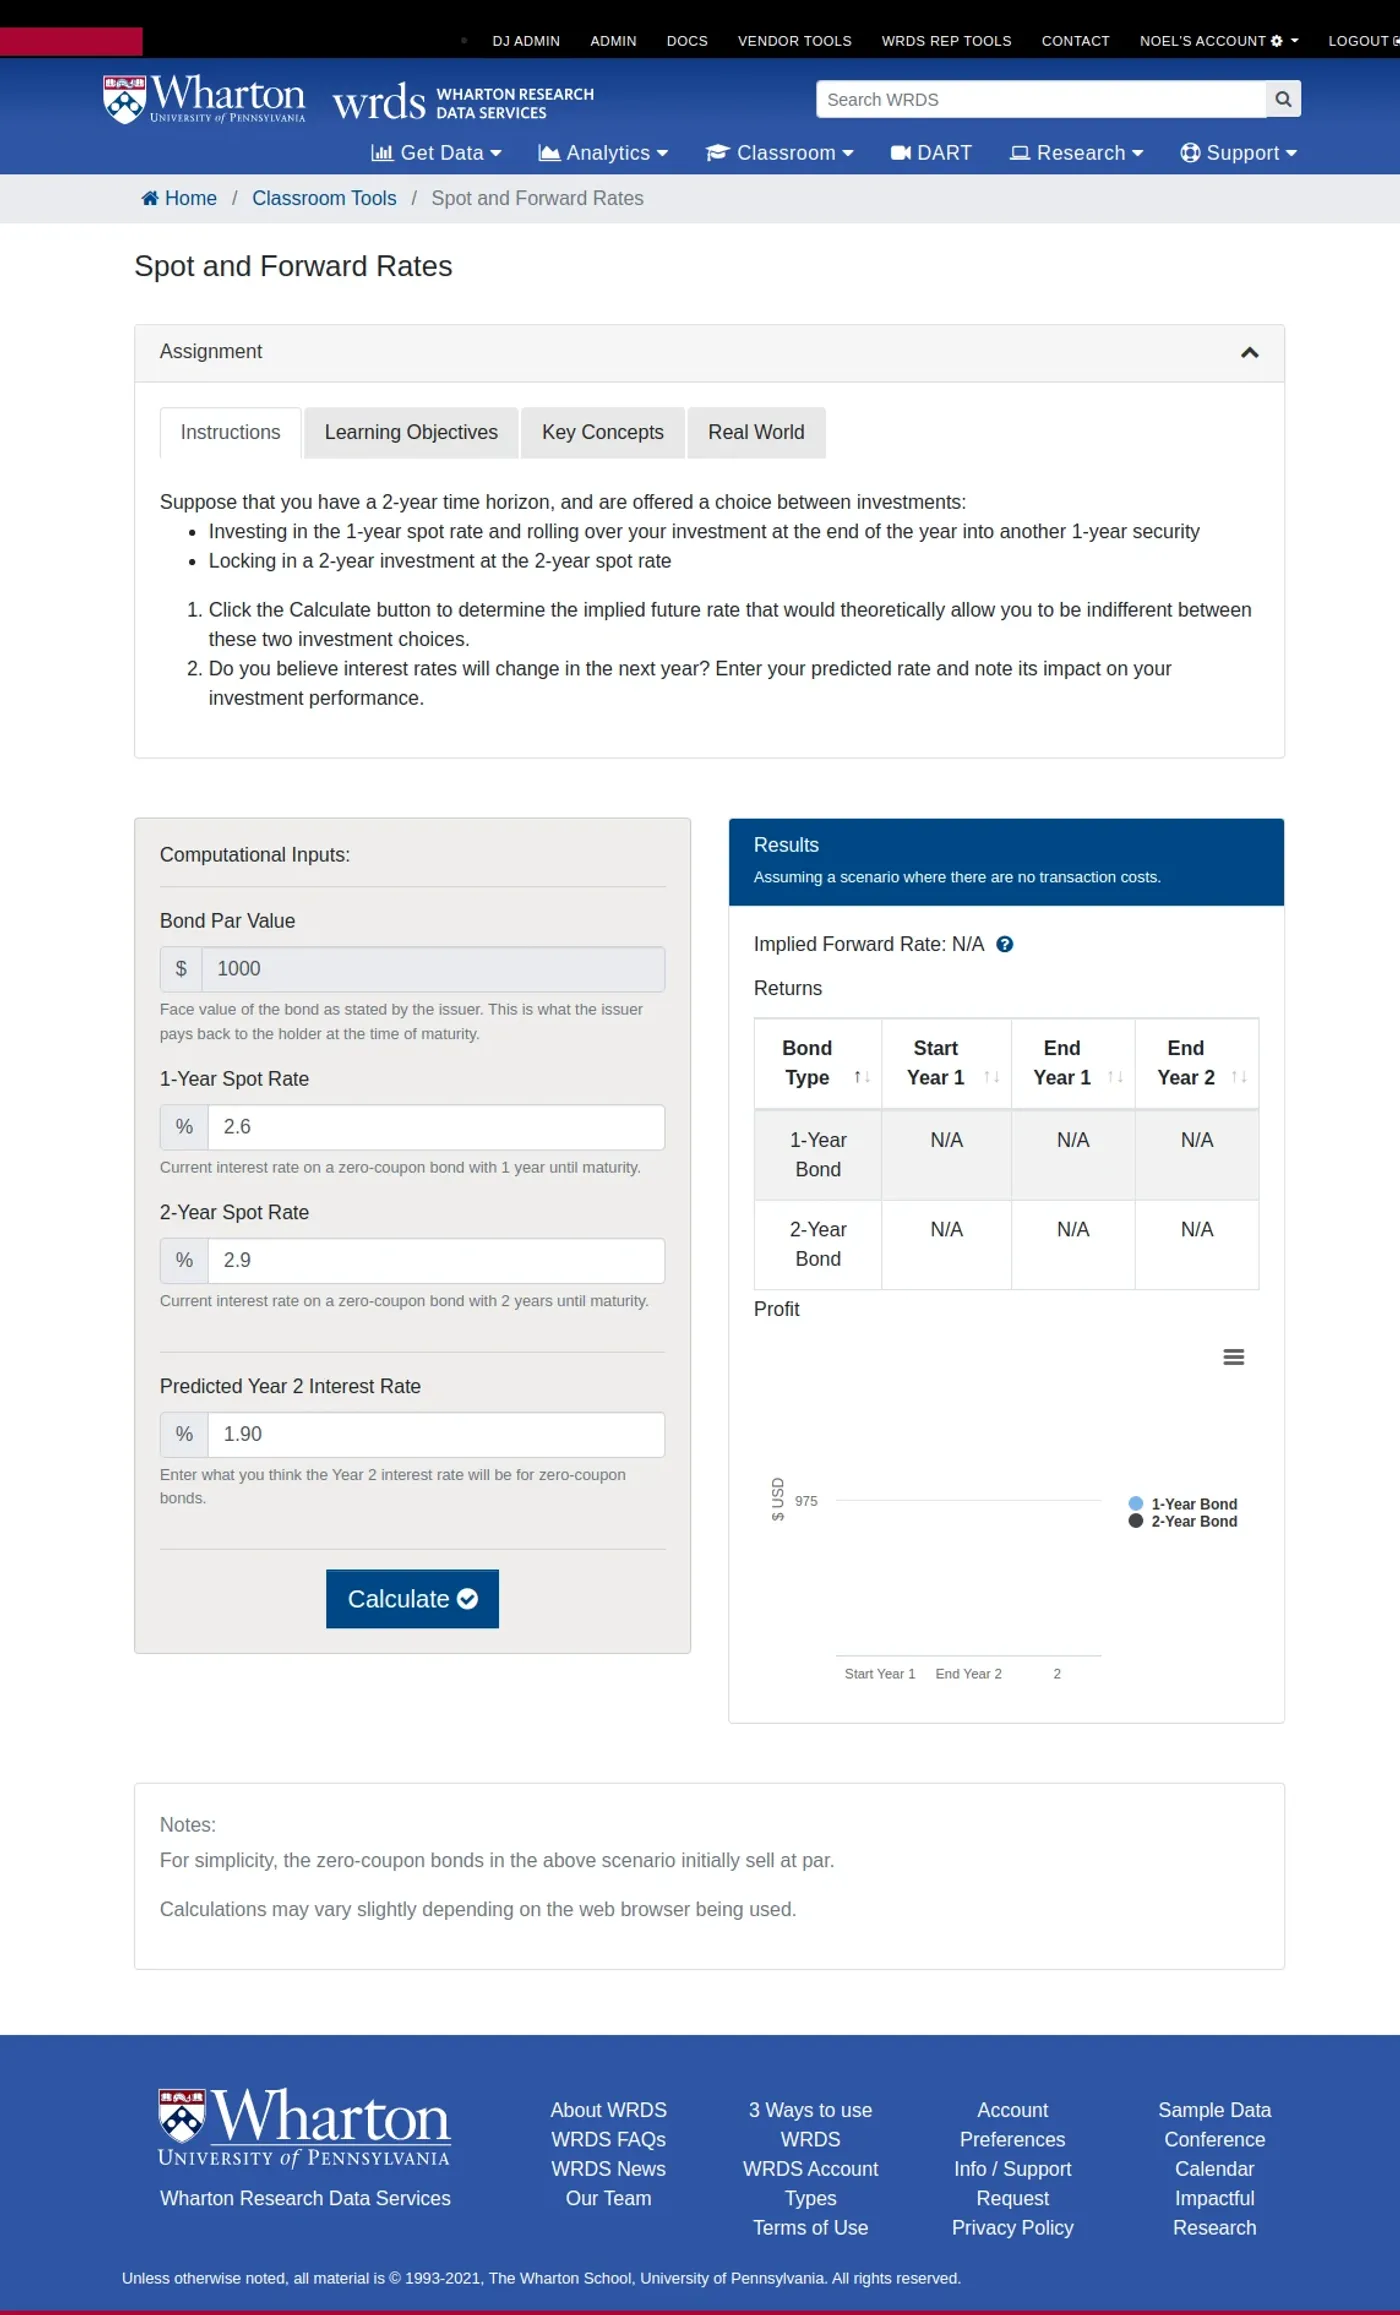
The range is wide on purpose, because finance teaching is wide. Yield curves and spot and forward rates. Options, including a binomial tree with its own calculator and a long call visualizer. Topic modeling with LDA, a lighter LDA variant, and NMF. VADER sentiment analysis. Executive compensation and board network comparisons built on Execucomp and BoardEx.
Working with the specialists, not around them
These were built with the people who teach the material. That changes what you build: a tool is not finished when the numbers are right, it is finished when a student can change an input and understand why the output moved.
Charting went to Plotly, Highcharts or D3 depending on what each tool needed, over a Python and Django backend with Postgres, fronted in Bootstrap 4.
Screens